


Learn how to create an Interactive Data Visualisation on a Map using Chart.js, OpenLayers and Next.js.


In recent past, I found myself confronted with a compelling challenge: how to seamlessly integrate data visualization with interactive maps. It was a puzzle I hadn't encountered before, but one that intrigued me deeply. As I delved into the intricacies of blending these two elements, I realized the immense potential it held for creating engaging user experiences.
The task wasn't just about writing code; it was about crafting an environment where users could explore data in a spatial context. It required me to rethink how I approached both data representation and map interaction. It led me to explore the combination of Chart.js' data visualizations with OpenLayers' maps—a journey filled with discovery and learning. Lets learn how to do this with an example case of show forest cover of each of India's states and UTs with the help of data available on RBI's website.
To start, we need to set up our development environment. In our toolkit, we'll be leveraging Next.js for building our web application, OpenLayers for creating interactive maps, and Chart.js for dynamic data visualization.
1. Setting up Next.js:
First, ensure you have Node.js installed on your system. Then, follow these steps to set up a new Next.js project:
npx create-next-app mapvisualisation
cd mapvisualisation
This will create a new Next.js project.
2. Integrating OpenLayers:
Install OpenLayers using npm:
npm install ol
Then, you can use OpenLayers to create a map component. Here we will create the components in a components folder inside the src folder, components/MapComponent.js:
'use client';
import { useEffect } from "react";
import "ol/ol.css";
import Map from "ol/Map.js";
import TileLayer from "ol/layer/Tile.js";
import View from "ol/View.js";
import XYZ from "ol/source/XYZ.js";
const MapComponent = () => {
useEffect(() => {
// OpenLayers map with a maptiler streets tileLayer
const mapInstance = new Map({
target: "map",
layers: [
new TileLayer({
source: new XYZ({
attributions:
'<a href="https://www.maptiler.com/copyright/" target="_blank">© MapTiler</a> ' +
'<a href="https://www.openstreetmap.org/copyright" target="_blank">© OpenStreetMap contributors</a>',
url:
"https://api.maptiler.com/maps/streets/{z}/{x}/{y}.png?key=" +
process.env.NEXT_PUBLIC_MAPTILER_API_KEY, // get your own api key at maptiler.com
tileSize: 512,
}),
}),
],
view: new View({
center: [79.035645, 23], // Longitude, Latitude
zoom: 4.8,
projection: "EPSG:4326", //WGS84 projection (because it's based on WGS84's ellipsoid)
}),
});
return () => {
// on component unmount remove the map to avoid unexpected results
mapInstance.setTarget(null);
};
}, []);
return (
<div className="absolute inset-0">
<div id="map" className="map"></div>
</div>
);
};
export default MapComponent;
This sets up a basic OpenLayers map in your Next.js project. Here we have used maptiler-streets view as the baselayer. Also don't forget to get you own API key at maptilers.com and append it to the url.
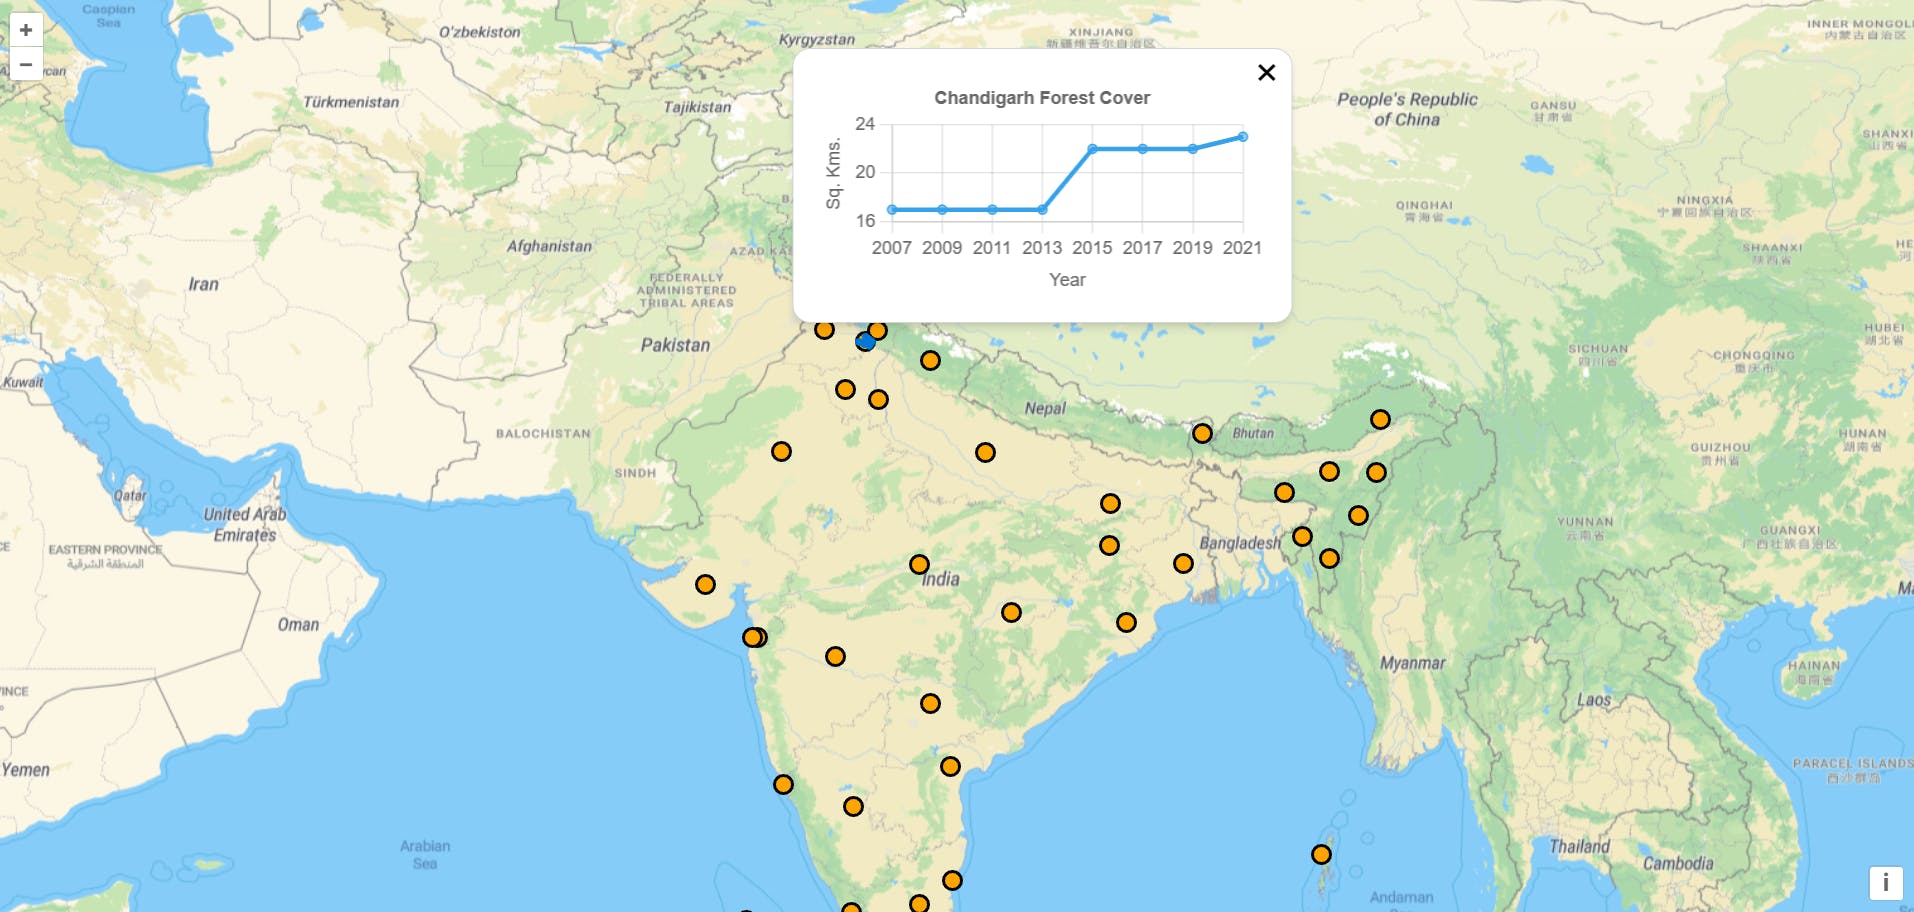
Now before implementing chart.js, we will have to add a vectorLayer on map which will show a set of points onclick of which will open a popup which will contain a linechart showing forest cover of all the states and UT's of India over last 5-10 years.
...
import { GeoJSON } from "ol/format.js";
import VectorSource from "ol/source/Vector";
import Style from "ol/style/Style";
import Circle from "ol/style/Circle";
import Fill from "ol/style/Fill";
import Stroke from "ol/style/Stroke";
import pointFeatures from "@/util/features.json";

const MapComponent = () => {

  useEffect(() => {
    // on component mount create a OpenLayers map with two layers

    // set features to be displayed in the vectorLayer
    const features = new GeoJSON().readFeatures(pointFeatures);
    features.forEach((feature) => {
      feature.set("cursor", "pointer");
    });

    // OpenLayers map with a maptiler streets tileLayer and a vetorLayer to show mark each state and UT of Bharat
    const mapInstance = new Map({
      ...
        new VectorLayer({
          source: new VectorSource({
            features,
          }),
          style: new Style({
            image: new Circle({
              radius: 6,
              fill: new Fill({
                color: "orange",
              }),
              stroke: new Stroke({
                color: "black",
                width: 2,
              }),
            }),
          }),
        }),
      ],
      ...
Here we have used a pointFeaturesgeoJSON file (available in the source code) to mark different states and UTs in India with a point marker. Now lets implement the popup from an overlay in OpenLayers . To do this we will refer the popup example on Openlayers site, plus we will add a state to maintain the current selected location. Here's the final MapComponent:
'use client';
import { useEffect, useRef, useState } from "react";
import "ol/ol.css";
import Map from "ol/Map.js";
import Overlay from "ol/Overlay.js";
import TileLayer from "ol/layer/Tile.js";
import VectorLayer from "ol/layer/Vector.js";
import View from "ol/View.js";
import XYZ from "ol/source/XYZ.js";
import { GeoJSON } from "ol/format.js";
import VectorSource from "ol/source/Vector";
import Style from "ol/style/Style";
import Circle from "ol/style/Circle";
import Fill from "ol/style/Fill";
import Stroke from "ol/style/Stroke";
import pointFeatures from "@/util/features.json";
const MapComponent = () => {
// set ref on different popup elements to access them
const popupContainerRef = useRef(null);
const popupCloserRef = useRef(null);
const popupContentRef = useRef(null);
// using state variable to manage the data location based on feature click
const [location, setLocation] = useState(null)
useEffect(() => {
// on component mount create a OpenLayers map with two layers
// set features to be displayed in the vectorLayer
const features = new GeoJSON().readFeatures(pointFeatures);
features.forEach((feature) => {
feature.set("cursor", "pointer");
});
// OpenLayers map with a maptiler streets tileLayer and a vetorLayer to show mark each state and UT of Bharat
const mapInstance = new Map({
target: "map",
layers: [
new TileLayer({
source: new XYZ({
attributions:
'<a href="https://www.maptiler.com/copyright/" target="_blank">© MapTiler</a> ' +
'<a href="https://www.openstreetmap.org/copyright" target="_blank">© OpenStreetMap contributors</a>',
url:
"https://api.maptiler.com/maps/streets/{z}/{x}/{y}.png?key=" +
process.env.NEXT_PUBLIC_MAPTILER_API_KEY, // get your own api key at maptiler.com
tileSize: 512,
}),
}),
new VectorLayer({
source: new VectorSource({
features,
}),
style: new Style({
image: new Circle({
radius: 6,
fill: new Fill({
color: "orange",
}),
stroke: new Stroke({
color: "black",
width: 2,
}),
}),
}),
}),
],
view: new View({
center: [79.035645, 23], // Longitude, Latitude
zoom: 4.8,
projection: "EPSG:4326", //WGS84 projection (because it's based on WGS84's ellipsoid)
}),
});
// creating an overLay to show the popup on.
const popupOverlay = new Overlay({
element: popupContainerRef.current,
autoPan: {
animation: {
duration: 250, // smooth operator
},
},
});
// create a handler to close the popup
popupCloserRef.current.onclick = function () {
popupOverlay.setPosition(undefined);
popupCloserRef.current.blur();
return false;
};
// add popup to map
mapInstance.addOverlay(popupOverlay);
// click event listner to check if clicked location has a feature on it
mapInstance.on("singleclick", function (evt) {
mapInstance.forEachFeatureAtPixel(evt.pixel, function (feature) {
if (feature) {
// if it has a feature then save the location to state variable hence create the visualisation and show the popup.
const coordinate = evt.coordinate;
setLocation(feature.get("location"));
popupOverlay.setPosition(coordinate);
}
});
});
// handler to change the cursor to pointer on hover of a feature on the map.
mapInstance.on("pointermove", function (evt) {
let hit = false;
mapInstance.forEachFeatureAtPixel(evt.pixel, function (feature) {
hit = true;
});
mapInstance.getTargetElement().style.cursor = hit ? "pointer" : "";
});
return () => {
// on component unmount remove the map to avoid unexpected results
mapInstance.setTarget(null);
};
}, []);
return (
<div className="absolute inset-0">
<div id="map" className="map"></div>
<div ref={popupContainerRef} id="popup" className="ol-popup">
<a
ref={popupCloserRef}
href="#"
id="popup-closer"
className="ol-popup-closer"
></a>
<div ref={popupContentRef} id="popup-content"></div>
</div>
</div>
);
};
export default MapComponent;
Now inside the div with id popup-content, we will add a component called DataVisualization which will contain our linechart made with chart.js based on clicked location which will be passed by location prop.
<div ref={popupContentRef} id="popup-content"><DataVisualization location={location}/></div>
3. Incorporating Chart.js:
Install Chart.js and it's react wrapper using npm:
npm install chart.js react-chartjs-2
Lets create this DataVisualization component based on example given at chart.js site.
import { useEffect, useState } from 'react';
import {
    Chart as ChartJS,
    CategoryScale,
    LinearScale,
    PointElement,
    LineElement,
    Title,
    Tooltip,
    Legend,
} from 'chart.js';
import { Line } from 'react-chartjs-2';
import chartData from '@/util/data.json';

function DataVisualization({ location }) {
    const [data, setData] = useState(null);
    const [options, setOptions] = useState(null);

    useEffect(() => {
        // on component mount check if a feature is clicked by checking the value of location state.
        if (!location) return;
        // if yes then setup the chart.js instance
        ChartJS.register(
            CategoryScale,
            LinearScale,
            PointElement,
            LineElement,
            Title,
            Tooltip,
            Legend
        );

        // from the dataset get the data of selected location
        let locationData = chartData.find(
            (data) => data.location === location
        ).data;

        // set x axis labels
        const labels = Object.keys(locationData);

        // set general options for the chart
        setOptions({
            responsive: true,
            plugins: {
                legend: {
                    display: false,
                },
                title: {
                    display: true,
                    text: `${location} Forest Cover`,
                },
            },
            scales: {
                y: {
                    title: {
                        display: true,
                        text: 'Sq. Kms.',
                    },
                },
                x: {
                    title: {
                        display: true,
                        text: 'Year',
                    },
                },
            },
        });

        // set the overall data
        setData({
            labels,
            datasets: [
                {
                    label: 'Forest Cover',
                    data: labels.map((year) => locationData[year]),
                    borderColor: 'rgb(53, 162, 235)',
                    backgroundColor: 'rgba(53, 162, 235, 0.5)',
                },
            ],
        });
    }, [location]);

    return <>{data && <Line options={options} data={data} />}</>;
}

export default DataVisualization;
Here we have used chartData JSON file which has the actual data. We use a useEffect with location as dependency, so after mount whenever location changes a new linechart will be created.
Now lets add MapComponent in app/page.js to complete our development.
import MapComponent from "@/components/MapComponent";
export default function Home() {
  return (
    <MapComponent />
  );
}
Run the server with npm run dev and visit http://localhost:3000/ in your browser to see the map.
References:
OpenLayers Documentation: https://openlayers.org/en/latest/apidoc/
Chart.js Documentation: chartjs.org/docs/latest
Forest Cover Data: https://www.rbi.org.in/scripts/PublicationsView.aspx?id=22165
Github Source Code: https://github.com/Shreyas-Ingale/map-visualisation
With this we have fully integrated Next.js, OpenLayers and Chart.js, hence creating an interactive map with a linechart to visualise data in spatial manner.
I hope this helps you in some way in your development journey.